
Do you measure query IO with SET STATISTICS IO ON ?
Introduction
In our tuning work and often in presentations we see people use SET STATISTICS IO ON as a handy way to measure IO, especially logical reads. But, not many people know that it skips measuring IO from certain types of objects (functions) and gives you falsely low numbers.
Here is a demo
First, we will create a big table in a tempdb and a table-valued function that full-scans that table and returns only one int value:
|
1 2 3 4 5 6 7 8 9 10 11 12 13 14 15 16 17 18 19 20 21 |
USE tempdb GO -- Create BigTable with 1 000 000 rows SELECT TOP 1000000 c1.* INTO dbo.BigTable FROM sys.all_columns c1 CROSS JOIN sys.all_columns c2 GO --Create a function that reads all 1 000 000 rows IF OBJECT_ID('dbo.fn_ReadBigTable') IS NOT NULL DROP FUNCTION dbo.fn_ReadBigTable GO CREATE FUNCTION dbo.fn_ReadBigTable() RETURNS @ret TABLE(dummy int) AS BEGIN INSERT INTO @ret(dummy) SELECT MAX(bt.object_id) FROM dbo.BigTable bt RETURN END GO |
Now, we will measure logical reads of a SELECT that full-scans big table, and compare it to logical reads of the same SELECT encapsulated in a table-valued function.
|
1 2 3 4 5 6 7 8 9 10 |
SET STATISTICS IO ON -- logical reads 8045 SELECT MAX(bt.object_id) FROM dbo.BigTable bt -- logical reads 1 ! How is that possible ? SELECT * FROM dbo.fn_ReadBigTable() GO |
|
1 2 3 4 5 |
(1 row(s) affected) Table 'BigTable'. Scan count 1, logical reads 8045, physical reads 0, read-ahead reads 0, lob logical reads 0, lob physical reads 0, lob read-ahead reads 0. (1 row(s) affected) Table '#182C9B23'. Scan count 1, logical reads 1, physical reads 0, read-ahead reads 0, lob logical reads 0, lob physical reads 0, lob read-ahead reads 0. |
Miracle?
Did we just miraculously optimized our FULL SCAN so from 8045 reads it went down to 1 read, an improvement of 804 500% ? No, we didn’t. It did the same full scan in both cases of all 1 million rows. Here is the estimated execution plan of the SELECT from a function:
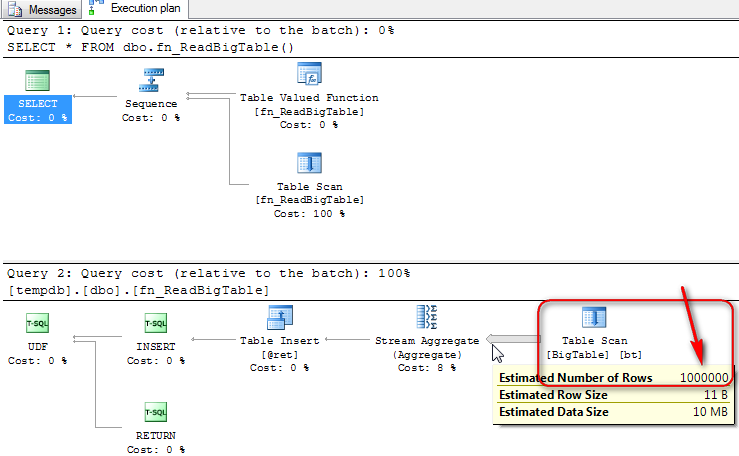
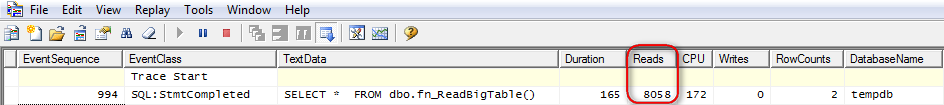
So, why SET STATISTICS IO showed us only 1 logical read? The reason is, it does not measure IO that is within a scalar or table-valued functions at all! It measured 1 IO needed to read the resulting @ret table variable that function returned. It measures tables, INLINE table-valued functions (views with parameters), views, but NOT scalar or table-valued functions. How to measure all IO of a statement that contains functions? Use profiler or extended events. Here is what profiler will give you, all logical reads:
Conclusion
If you have functions (except INLINE table-valued functions) in your SQL statement, you can’t measure IO with SET STATISTICS. Use profiler instead.
In profiler I only see a Reads number. Can profiler be set to show logical/physical reads as separate numbers?
Profiler shows only logical reads – the only important one IMHO. There is no option to show you physical reads in profiler. Query can read or write only memory (pages in buffer pool cache, to be specific), it cannot read the disk or write to disk directly. First time the query executes (let’s assume server just started) pages are not in buffer cache so there will be e.g. 1000 physical reads (to bring pages from disk to buffer pool) and 1000 logical reads (fetching those pages from buffer pool and doing some work with them). The second time query executes, all the requested pages are in buffer pool already, so there will be no physical reads, and you will see again 1000 logical reads. Logical reads is the only stabile number you can rely on. You should tune only logical reads to make them smaller and measure your success only with logical reads. If you make logical reads lower, physical reads will also be lower or even dissapear. Physical reads only show that you do not have enough RAM to cache entire DB, or you are fetching some pages for the first time. Physical reads are not so important really. You can buy more RAM and/or tune logical reads and physical will dissapear or be much smaller.
Writes are also done only to memory (buffer pool – logical writes) if we put aside transaction log. Physical writes are done not from the user session scope, but by an asynchronous process called CHECKPOINT which fires about once every minute, depending on some settings and amount of db changes. Also, some events can initiate CHECKPOINT, even manual checkpoint commad.
Thanks, this helped me! I wish STATISTICS IO would show the result of the functions though.
Very well done and helpful. Thank you !