
Page Life Expectancy and 300 sec limit
People blogged about it, including excellent Jonathan’s post here (highly recommended to read), but I will give a little more insight here. Basically, Microsoft says if PLE is below 300 seconds, we should worry about memory pressure (an old recommendation from 2006. still appearing today here and there). Jonathan shows how 300 sec threshold is obsolete, and that it should be per every 4GB of RAM. That makes a big difference on current servers which have much more RAM than 4GB. I will split it down to the NUMA node level, because today’s servers not only have plenty of RAM, but also plenty of CPU’s which are grouped into NUMA nodes, and so is the memory divided into memory nodes.
That means the PLE limit is better calculated per memory node. If we calculate it globally, it might hide the fact that a single memory node falls way below the treshold, because other numas are in good standing, healthy. If we look only global PLE we will not notice that one numa node’s PLE is not ok.
The Formula
The Jonathan’s formula for the PLE treshold to worry about is “(DataCacheSizeInGB/4GB)*300”. That means PLE of your system should normally be higher that that number. If you have 4GB of cached data, your treshold is 300 secs. If you have server with a lot of RAM, e.g. 40GB is cached, your PLE treshold should be 3 000 seconds. Basically, PLE should be 300 sec per every 4GB of data you have cached in the buffer pool.
This is the query of the PLE per NUMA node, normalized to 4GB, baked ready for you:
|
1 2 3 4 5 6 7 8 9 10 11 |
-- ple_per_4gb of every NUMA node should be > 300 sec ! SELECT numa_node = ISNULL(NULLIF(ple.instance_name, ''), 'ALL'), ple_sec = ple.cntr_value, db_node_mem_GB = dnm.cntr_value*8/1048576, ple_per_4gb = CASE WHEN ple.instance_name = '' THEN (SUM(ple.cntr_value) OVER()-ple.cntr_value) * 4194304 / (dnm.cntr_value*8) ELSE ple.cntr_value * 4194304 / (dnm.cntr_value*8) END FROM sys.dm_os_performance_counters ple join sys.dm_os_performance_counters dnm on ple.instance_name = dnm.instance_name and ple.counter_name='Page life expectancy' -- PLE per NUMA node and dnm.counter_name='Database pages' -- buffer pool size (in pages) per NUMA node |
Example1
This server has more than 64GB of RAM, and a lot of CPU’s (around 80 cores) divided into 4 hardware NUMA nodes. The query result is below. All NUMAs have good PLE (ple_per_4GB is > 300 sec):
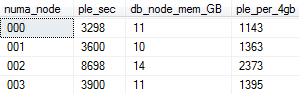
We can see that the values are not equal. ple_per_4gb of the best numa node is more than 2x larger than the worst numa, so global PLE might not be detailed enough in some situations and you may want to go to the NUMA level.
Example2
This server has a bit less CPUs than in previous example, but still a bunch of them, so they are divided into 2 hardware NUMA nodes. Server has a lot more memory, around 800 GB, quite a beast! One would expect that would be enough to have a good PLE. But surprisingly, the ple_per_4GB is below 300 sec:
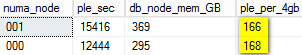
This server has a problem. If memory is not reused efficiently, the performance will rely on the disk which is much slower than memory, and will generate a lot of disk IO and stress the storage. So, by looking at the PLE normalized to 4GB and per numa node, we can spot the opportunity for optimization and investigate further (which objects are using the most of buffer cache memory, the distribution of “hotness” of it’s indexes and partitions etc).
Summary
Use the query above to get per NUMA, 4GB normalized values of PLE. Then you can use the fixed treshold of 300 to raise an alarm or start the investigation.
UPDATE: 28.2.2018 Corrected “all” row in query
“This server has a problem”.
OK, but with 400gb per node WHY does that server have a problem?
We can guess: something is happening to flush the cache every few minutes. So it is possible that memory is plentiful and efficiently used, except for these events.
You never say otherwise, but much discussion about PLE is in the context of “memory pressure”, and I just like to point out that while PLE is an excellent indicator, what it indicates may not really be memory pressure at all.
Thanks.
Good thinking. PLE tells us how long average page stays in buffer pool. If we do only inserts (ETL into data warehouse), and no user is doing selects, PLE will be related to the speed at we are loading the data. If we have 800GB of RAM like this server, and PLE of 14 000 sec, that could be achieved by loading the data at speed 57 MB/sec (800GB / 14000 sec). Quite achievable. To detect memory pressure just PLE is not enough. But it is an indicator we should look at together with other to get a real picture of the situation.
This is what i was looking for. Excellent and thank you!
One quick question, I used your query both in SQL 2012 and 2008 with multiple numa node servers. I am getting result set only on the SQL 2012 servers not in the 2008 server. I am not sure why and trying to find how I can use the same query for SQL 2008 to get the PLE value for each numa node.
Thank you in advance for any suggestion.
It is because the counter “Database Node Memory (KB)” does not exist in SQL2008R2. I adjusted the query to use “Database pages” instead, so it shows results even on versions prior to SQL2012, plus a little bonus: “ALL” nodes row.
Thank you Van!
Is the value for ple_per_4gb for ‘ALL’ being calculated correctly?
This value is based on the SQLServer:Buffer Manager:Page life expectancy counter, which is the harmonic mean of all the NUMA node’s SQLServer:Buffer Node:Page life expectancy counters.
Shouldn’t we be using the harmonic mean of the NUMA node’s ple_per_4gb values?
Here are the values that I am seeing that do not make sense:
numa_node ple_sec db_node_mem_GB ple_per_4gb
ALL 4370 156 111
000 7755 40 766
001 24156 39 2427
002 1849 40 180
003 4897 35 552
Good catch Jeff!
I think the query should be modified to fetch PLE of “ALL” row from “\SQLServer:Buffer Manager\Page life expectancy” and for per-node rows stay with “\SQLServer:Buffer Node(*)\Page life expectancy”.
Thanks for spotting this!
Hi Vedran
In your example 1 how much did you have of DataCacheSizeInGB?
I have a Server with 80 CPUs and 767GB de RAM and allocated for SQL Server 650GB, my DataCacheSizeInGB is 650GB my account (650 /4GB) * 300=47,60
Is correct? That’s nice?
I do not feel like it, but I would like your opinion.
My collection I use Buffer Manager – Page Life Expectancy
I should switch to SQLServer:Buffer Node(*)\Page life expectancy
or can I use both ?
Currently my PLE between the 14PM and 18PM is 48993 after 22PM and 03AM between 246 and 600
at this time execution Backups,Rebuild, Reoganizer index, Update Statistics and processes databases.
thanks
Hi Fabiana,
Thanks for asking. You have a big machine 🙂
650GB / 4GB = 162,5. That x 300s = 48 750 seconds. That would be expected minimum PLE for that machine, if it would have single memory node.
But big machines usually have more than one memory node, eg 2 or 4.
IMHO, it is much better to use per-node PLE counter, because a single memory node can have a problem that we cannot spot if it is averaged-out with other nodes’ PLE result.
The PLE between 14PM and 18PN seems a bit above expected minimum. It is normal that during huge imports or index maintenance we see a huge drop in PLE.
But during normal work hours this PLE is at minimum, which is a bit worrying. You might want to check are there “memory-low” messages in ring buffer. Maybe some query does a scan on huge table because lack of index.
Big queries as well as a selected set of perfmon counters you can easily capture using the blog post Collect Performance Data
Regards,
Vedran