
SQL Profiler for Developers and Testers
Introduction
You developed a new TSQL code and want to check is there a slow SQL statement inside and which is it? Or you debug the code and want to know which statement throws error, maybe inside of a trigger or calculated field which calls a function that fails and is not immediately visible what is happening? Or you test application on QA environment, and want to check for SQL errors or slow statements to return them back to dev for correction before problems hit production? Then read on…
SQL Server Profiler
For production, we would create Extended Events session that would capture slow queries, like the one I recommend you to get from here and install on all your productions. But for direct view, as developers and QA testers would like to see, SQL Profiler is still the best tool to use. Maybe in the future the GUI for Extended Events will improve, as it is planned to completely replace SQL Profiler, but for now it is not the case yet.
SQL Profiler enables you to view what happens inside SQL Server, it captures events you are interested in. Watch how to set it up:
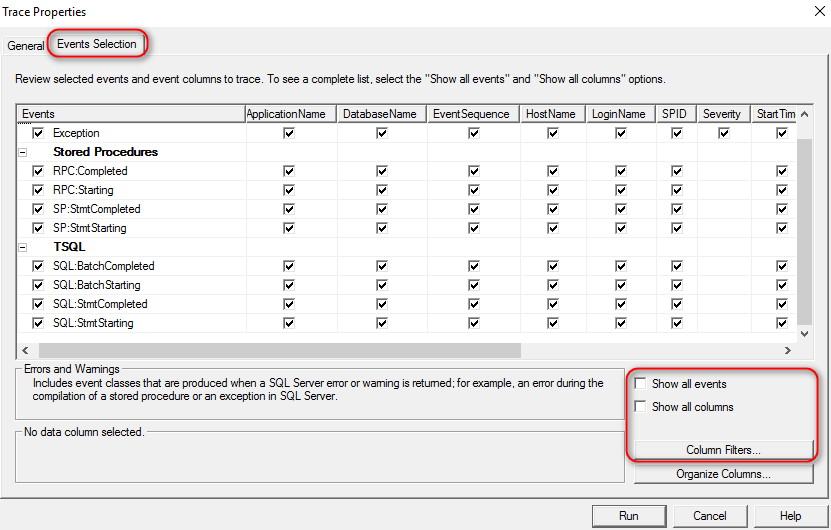
Events to capture
If we store set of commands in the database as an object, for example a stored procedure, we capture their execution with events “Stored Procedures” -> RPC:%, SP:%. If we do not store them, and just are sending batch of sql command to sql to execute, we capture them with “TSQL” -> SQL:% events.
For slow queries, we are interested only in “%Completed” events, because they contain performance information like duration:
- Stored Procedures \ RPC:Completed
- Stored Procedures \ SP:StmtCompleted
- TSQL \ SQL:BatchCompleted
- TSQL \ SQL:StmtCompleted
Filter them to logical “Reads” (my favourite) higher than eg 10 000 reads, or “CPU” time more than eg. 5 000 ms, or “Duration” more than eg. 5 000 ms.
For capturing Errors
- Errors and Warnings \ Exception
Filter it by “Severity” >= 11
For Debugging
Capturing only “Exception” event will not tell us who threw it, just that error X is happening. We need to add “%Starting” events, which will MASSIVELY increase number of captured events. Therefore, you should either be on a quiet machine (eg. only yours) or you MUST filter rigorously to catch only our query of interest.
The list of events to capture for debugging:
- Errors and Warnings \ Exception, filter by “Severity” >= 11
- Stored Procedures \ RPC:Starting
- Stored Procedures \ SP:StmtStarting
- TSQL \ SQL:BatchStarting
- TSQL \ SQL:StmtStarting
Filter it rigorously, especially if you watch production server. Use:
- LoginName – useful if you use your personal login
- ApplicationName
- DatabaseName
- HostName – it is a client machine name that is connected to SQL
If that is not “quiet” enough (eg, busy production), filtering these might help. But those will hide some events, so use them only if necessary and tweak the filter:
- TextData
- ObjectName
The statement that caused the error will be first above the error, of the same SPID (session ID) as the error.
Make it pretty
Remove columns you do not need, make it clean. And order them with “Organize columns” button. I usually take only these columns, in the order as on this picture:

Save as Template
When you invested a time to carefully craft your set of events and filters, you do not want to spend that time again – save it as a template and send it to all the SQL server people you love, so they do not have to do that themselves!
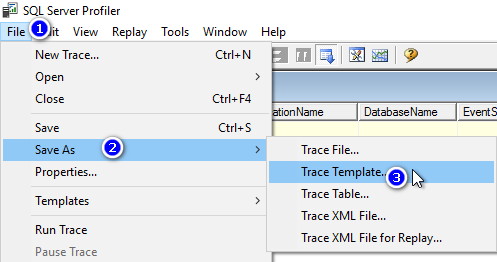
It is not so straightforward, as we need 2 steps:
- “Run” the trace (because with “Cancel” you would loose all your hard work!) and “Stop”. File -> Save As -> Trace Template. Give it a meaningful name. That saves it to the registry:
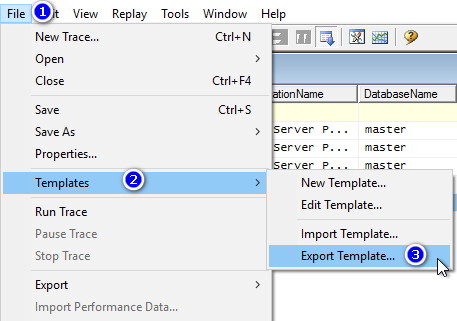
- Export to a file. File -> Templates -> Export Template. Enter a file name, usually equal to template name:
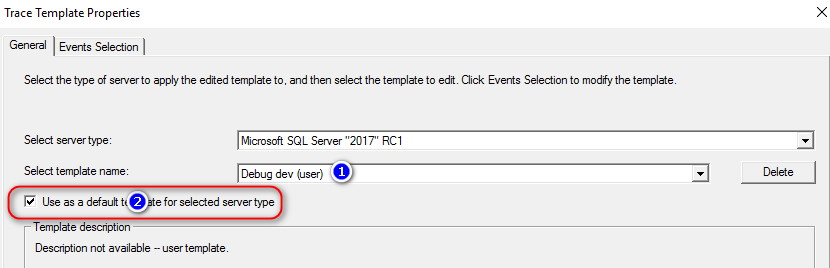
To install that trace template file (*.tdf) on a new machine, just double-click it and that will import it to SQL Profiler (registry) – super simple! After that you will be able to select it, or even better make that template as “default” one, instead of not so good “Standard” template. Go to File -> Templates -> Edit Template, choose your template, and check “Use as default…” and press OK:
 I hope that was useful!
Conclusion
Use SQL Profiler to create yourself a template for capturing slow statements, errors, or for debugging, and send it to people you love 🙂
love the article………
very helpful for developers as well as testers……
must read…….
keep updating………thanks……