
CHECKPOINT vs LAZY WRITER
Checkpoint and Lazy Writer are somewhat similar. They both write pages from buffer pool memory to the disk. So, what is the difference?
CHECKPOINT‘s goal is to shorten database recovery time (e.g. after a server crash), therefore increasing availability. It makes data files not lagging too much behind the transaction log. Recovery of every single database starts at the last checkpoint and rolls-forward all the transaction log records from that point on. If checkpoint was long time ago, it could be that amount of log to roll forward is huge and it can take considerable time. During that time your database is unavailable, affecting availability (you have longer downtime). More frequent checkpoints means less amount of log needed to roll-forward, resulting in faster recovery. Too frequent checkpoints make buffer pool caching less efficient and can negatively affect performance. E.g. you don’t want to checkpoint every second. Frequency of automatic checkpoint is determined by recovery interval option and the log generation rate, and usually is around every 1 minute. Some TSQL commands also do a checkpoint inside, like BACKUP DATABASE command for example. Such checkpoints are called “Internal”. And we can do a manual checkpoint by invoking a CHECKPOINT tsql command.
LAZY WRITER purpose is to release the buffer pool memory (for pages cached in buffer pool) when memory pressure occurs. When more memory is needed (e.g. for bringing in new pages to the cache), lazy writer responds to a memory pressure releasing the “coldest” pages from the buffer pool, and makes more memory available for new pages to come in. And that is normal to see that lazy writer occasionally “makes a room”. But if lazy writer constantly has a lots of work to do, starting to purge pages that are not old at all (you see ‘Buffer Node:Page Life Expectancy’ perfmon counter stays below DataCacheSizeInGB/4GB *300) – you have a problem with buffer cache memory. You do not want pages flow though the buffer cache like a rapid river. You want them to stay there and be reused, read/written and rewritten again in-memory and not the disk which is slow compared to memory, as long as possible. Low page life expectancy nullifies buffer caching purpose, affecting performance.
They both write in-memory pages to the data files on the disk. But Which pages, when, and do they release memory or not – there is the difference!
CHECKPOINT writes only dirty pages pages to the disk (dirty = changed in memory since the last checkpoint, not yet written/checkpointed to disk), making them “clean”. Checkpoint does not release any memory, the pages STAY in memory, they are not removed from the buffer pool!
LAZY WRITER looks for least recently used (“cold” = least recently read or written, not accessed in recent time) pages in the buffer pool, and releases the memory taken by them. Lazy writer releases both dirty and clean pages. Clean pages can be released without writing to disk, but dirty pages must first be written to the disk (“flushed” to the disk and become “clean”) and then buffer pool memory can be released. So, total number of pages that lazy writer releases can be higher than the number of pages lazy writer writes to the data files, because “clean” pages can be released without writing them to disk. The final result of the lazy writer is less buffer pool memory used, therefore more memory available for the fresh pages in the buffer pool.
There is another difference: checkpoint process is more efficient in writing to the disk because it can group subsequent pages into larger disk IOs, e.g. 128KB IO size. It internally uses WriteFileGather Windows API function. For details, see here and here. Lazy writer can only write 8K pages. Therefore checkpoint disk throughput is much better than lazy writer’s.
How to track their activity?
Easiest is probably through the performance counters:
|
1 2 3 |
SELECT * FROM sys.dm_os_performance_counters WHERE counter_name in ('Checkpoint pages/sec', 'Lazy writes/sec', 'Page life expectancy') |
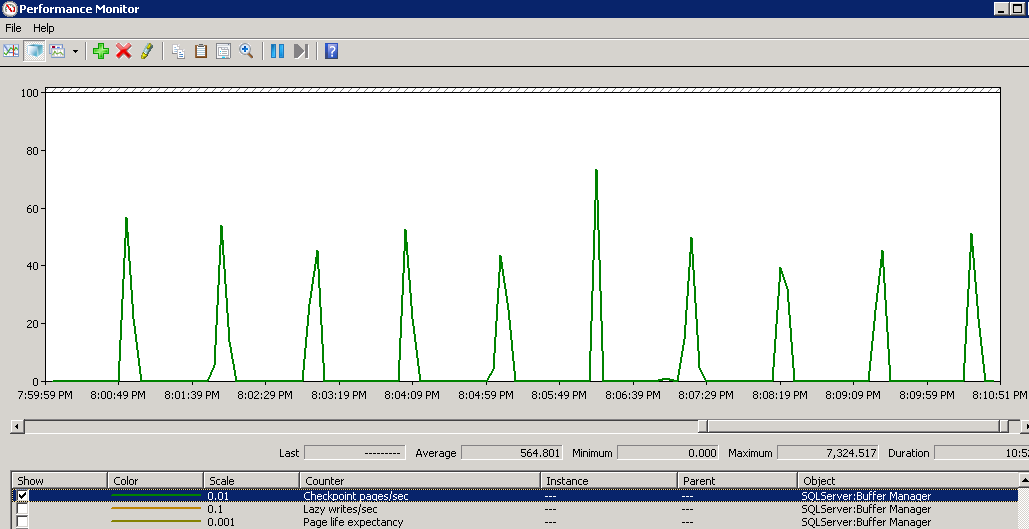
Using perfmon graph, we can see checkpoint is happening here about every 1 minute, and writes up to 7 000 pages per second (almost 60 MB/sec):
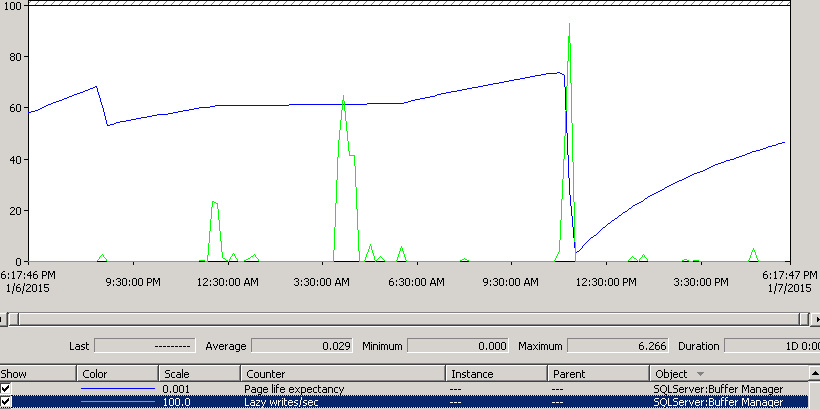
And a Lazy Writer activity (green line) is much less frequent (doing nothing for hours, maybe that’s why it is called “lazy” 🙂 ) and not in regular intervals. We can also see that it goes up to a very low write speed (6 pages per second or IOPS, in this example):
There is a DM view that shows all the pages currently in a buffer cache of a instance, for all user and system databases: sys.dm_os_buffer_descriptors. It is really useful, since it has “is_modified” flag (or “dirty”), and we could also see the size of the buffer cache each database takes.
|
1 2 3 4 5 6 7 8 |
select database_name = db.name, object_name = o.name, object_type = o.type_desc, bd.* from sys.dm_os_buffer_descriptors bd join sys.databases db on db.database_id = bd.database_id left join sys.partitions p on p.partition_id = allocation_unit_id left join sys.all_objects o on o.object_id = p.object_id where bd.database_id = DB_ID() -- current db only --and bd.is_modified=1 |
There is also a nice video from Paul Randal on tracking checkpoints: http://www.youtube.com/watch?v=7v_ACYE5P-Q
And another useful link: http://www.sqlskills.com/blogs/paul/page-life-expectancy-isnt-what-you-think/
Conclusion
User session do not perform writes to the data files (set aside transaction log). They write their changes (ins/upd/del) only to a memory (buffer pool). So every user write is a “logical” write. The job of writing to disk is asynchronous to user sessions, process separated from them. CHECKPOINT is the main process that does very efficient writes of changed (dirty) pages to data files, so data files do not lag too much behind transaction log, assuring recovery of the database (e.g. in case of crash) will be fast. LAZY WRITER’s purpose is to release the buffer pool memory when memory pressure occurs, by releasing least recently used pages. If they are “dirty” lazy writer writes them to data files before they are released from memory. “Clean” pages are released without writing to disk.
Awesome..
Fantastic Article.. Given clear explanation about Checkpoint vs Lazy Writer
Hi sir , this is awesome explanation.
I have one query
Does log for every action directly goes to .LDF? or it goes to log cache 1st and then to .LDF once check point occur?
Hi Sagar. Every action that changes something (rows, schema) results in seria of Log records that describe what changed into what. These Log records first go into log cache. On COMMIT of transaction (and some other events, like when log cache is full), log cache is flushed (written) to the log file (.ldf). Log cache size is 60KB, so max IO size of log write operation is 60KB. WRITELOG wait type describes waiting for the disk to perform write to the log file.
But that is not related to CHECKPOINT process which writes dirty (changed) pages to disk, to make pages in data files (.mdf, .ndf) equal to cached pages.
Hi Vedran,
As we can maually trigger CHECKPOINT, can we manaully trigger LAZY Writer or atleast can we set the time interval for the LAZY Writer to trigger.
Thanks in advance!
Hi Sadia, thanks for the question!
No, we cannot trigger lazy writer directly, not to my knowledge. It’s purpose is to free buffer pool cache memory when someone requests memory and there is not enough available. We do not need to micro-manage the memory allocation/deallocation process, it is a task of SQL Server to take care of that automatically. What we should take care of is to proper setup the system. For example correctly set “MAX server memory” parameter, detect bad queries (that scan large indexes), detect single-use queries that fill-up plan cache because they do not use parameters, etc.
Hi Vedran,
I have a small doubt……..
Will checkpoint write Dirty Pages and also Log Records from Memory to Disk?
Yes, it will write both, and will also write a new log record that checkpoint occurred. We can have a lot of dirty data pages, but there are close to zero unwritten log records. Because the cache for log records is intentionally tiny, only 60KB per database, and every COMMIT flushes that cache to disk.
Thank you sooo much Vedran
Hi Vedran,
I’m coming back with new question,
In memory architecture we have two memory ares i.e Buffer pool and Non buffer pool(MTL).
As per my knowledge Lazy-writer will clean old dirty pages in buffer pool when checkpoint occurs.
So my doubt is who cleans Non Buffer pool(MTL), is there any background process for it………..???? like lazy-writer.
I referred few blogs,I didn’t found solution. I hope i’m expecting reply from you.
Thank you,
Veeru.kodavalluri
Checkpoint saves pages to disk making them “clean” (RAM=disk), but does not release memory. Lazy writer releases memory of least used pages, and writes them to disk if they were “dirty”.
For non-buffer pool caches, a “clock hand” mechanism is used. Entries get initial “cost” which is reduced on every periodic “sweep” of the clock hand for entries that were unused. Entries that reach cost of zero can be evicted from the cache first.
Hi Vedran,
Thank you for the reply, that was really impressive and your knowledge sharing is helping me to learn lots of new things. Just one quick question is there any background process that does the cleanup.
Checkpoint and Lazy writer can be seen with this query:
SELECT r.* FROM sys.dm_exec_requests r
WHERE r.command IN (‘LAZY WRITER’, ‘CHECKPOINT’)
But a thread that runs clock hand sweeps, seems is not exposed through that view.
It should be in sys.dm_os_threads, but what actually useful data would you get by finding exact thread number?
Actually useful data about clock hand sweeps can be seen through view sys.dm_os_memory_cache_clock_hands.
I have few SPID in BackGround status in SQL sever and it have huge CPU time , does it cause slowness in the DB ?
activity monitor, lazy writer are also in Background status and have High CPU time does it slow down other process ?
Hi Lakshami.
In sys.dm_exec_requests, cpu_time is measured from start_time in miliseconds. To get average cpu pct you need to divide cpu_time with time elapsed from start_time till now and divide that by core count on the server. Since lazy writer and other background tasks are long time on server, I believe they are not caouse of your server’s problems.
To identify what are the problems and root cause, I suggest you to install performance logging from here: https://blog.datamaster.hr/collect-performance-data/
Check current queries you see most often (eg with sp_WhoIsActive), analyze wait stats. Or hire an expert (eg. me) that is skilled in troubleshooting performance problems.