
PowerBI for SQL DBA – Investigating Perfmon Counters
Introduction
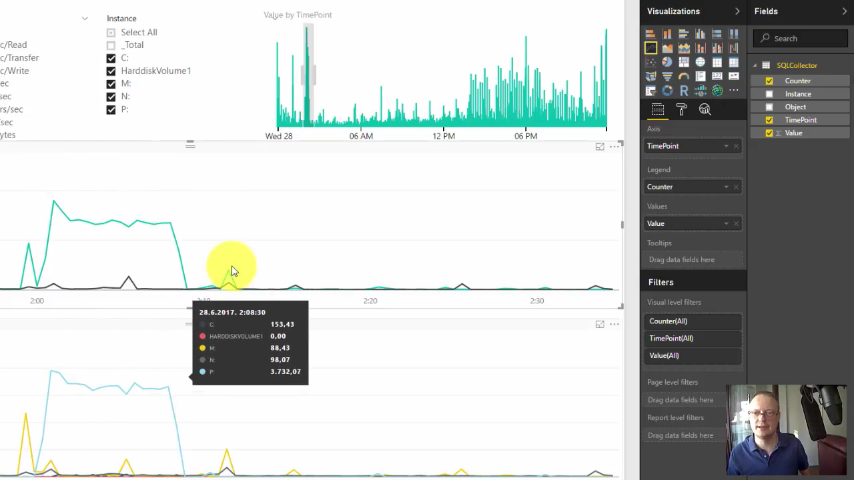
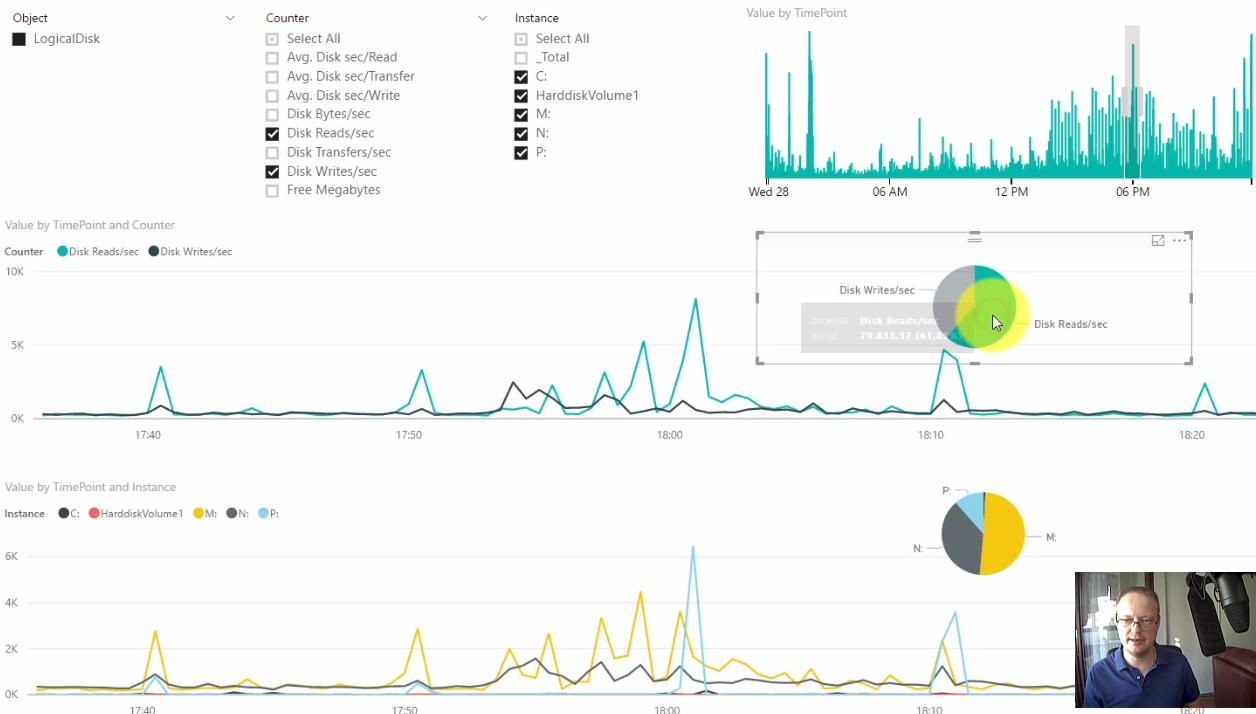
PowerBI Desktop is a free tool from Microsoft you can download here. Paid versions also exist for Cloud and on premise (your servers), to easily share reports and view them on any device, not just PC. It is used for graphical analysis of any data, by clicking at the beautiful graphs and digging useful information out of it. This demonstration is analyzing Perfmon Counters data needed for SQL Server or Windows performance investigation, but similar process can be used on any data. It is intended for learning and get feeling what PowerBI is and how useful can it be.
This video is intended for PowerBI beginners, Windows administrators, SQL Server DBAs, Techical managers, and anyone who wants to make informed decisions based on investigating data using PowerBI. Enjoy!
The visualization component used for slicing time is called “Time Brush Slicer” and can be downloaded for free from Office store here.
The relog command used is:
|
1 |
relog.exe "L:\temp3\powerbi\SQLCollector_06272352.blg" -o "L:\temp3\powerbi\SQLCollector.tsv" -f TSV |
You are more than welcome to post below your questions, opinions, critics, praises, ideas, suggestions and whatever you like.
Thanks Vedran !
We learned a lot about how to use PowerBI watching this, and got a useful tool to boot!
I’m pretty new to Power Bi, is there an easy way to handle different perflog csv files from different servers having different names within the column headers. When I try change the data source to a perflog file from another server I get an error about not being able to find the second column as the server name is different. The only way I could think to work around this would be to write some PowerShell to rename the csv headers before I change the data source or edit them manually in Excel. If there is an easier way to achieve the same thing in Power Bi that you could share that would be appreciated.
Ahh silly me, when your in the data transformation wizard instead of making the top row the header instead rename the columns manually i.e.\\SERVERNAME\Memory\Available Bytes and then delete the top row that contains the header from the csv file. Doing this will ensure that the headers will always be named consistently even if your server names change in each csv file, allowing you to reuse the chart for multiple servers.